Download Gold (XAU/USD) Price History
Gold is the most-requested series in this catalogue, and also one of the easiest to get subtly wrong: "gold price history" can mean spot XAU/USD, a futures contract, or a daily auction fix — three different series that disagree with each other. This guide covers what the spot series is, exactly how far back it goes at each timeframe, and how to pull it onto your machine cleanly.
Get the app — €9 →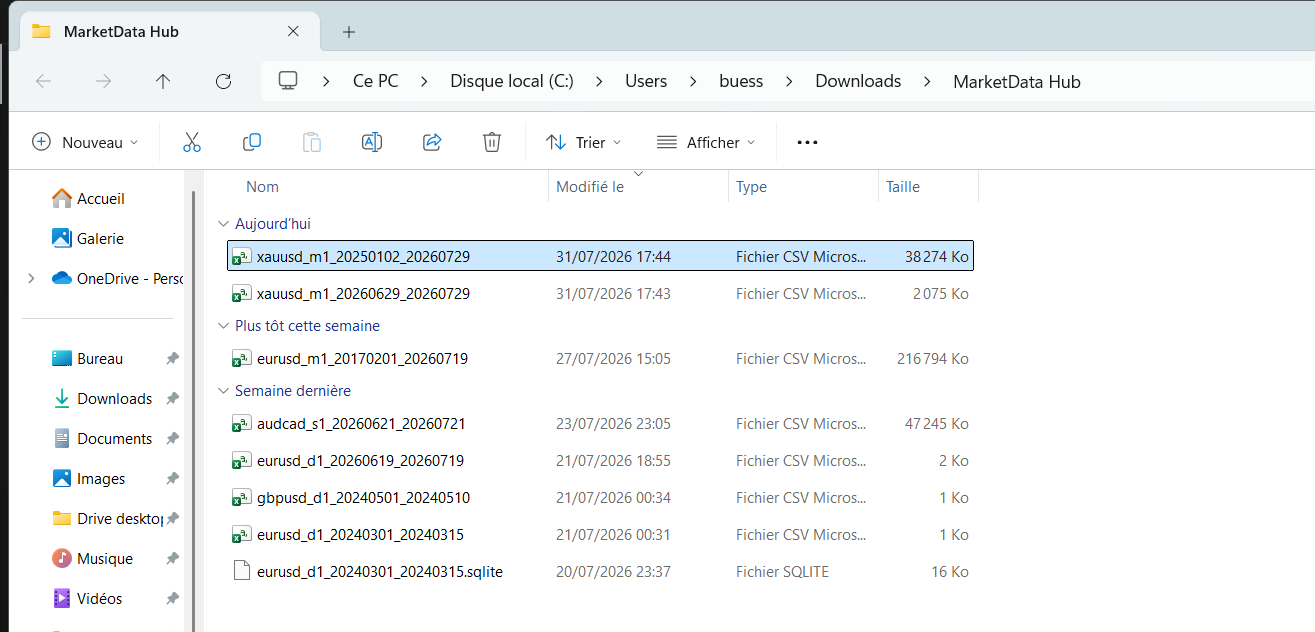
Which gold series this is
XAU/USD is spot gold — a continuous two-way quote for one troy ounce of gold in US dollars, the series FX platforms trade. It is not COMEX gold futures (which carry roll dates and a term structure) and not the LBMA auction price (a twice-daily fixing, one print per auction). For charting, backtesting and most research the spot series is what you want: continuous, quote-level, no contract stitching.
How far back the data goes
From the per-timeframe metadata (the same numbers the instrument page shows):
- Daily and monthly candles from 1999-06-03 — the whole 2000s bull market, the 2011 top, the 2013 crash, the 2015 trough and everything since.
- Intraday candles and tick data from 2003-05-05 — roughly four years less than the daily series, the usual tick-vs-daily gap.
What makes gold data different
- A ~23-hour session. Spot gold trades Sunday evening to Friday evening with a short daily break — so a gold "day" does not align with an equity trading day. Joining gold candles to stock data on the date column alone silently misaligns the series.
- Weekend gaps are real. Unlike crypto, gold closes for the weekend; missing Saturday rows are market structure, not missing data.
- Dollar-quoted, dollar-sensitive. XAU/USD moves are part gold, part dollar. For studies that need to separate the two, pair it with XAU/EUR or the dollar index.
How big the files get
| Timeframe | History from | Approx. rows | Approx. CSV |
|---|---|---|---|
| Tick (every quote) | 2003-05-05 | very large | — |
| 1 second | 2003-05-05 | very large | — |
| 1 minute | 2003-05-05 | ~8.5M | ~423 MB |
| 5 minutes | 2003-05-05 | ~1.7M | ~85 MB |
| 15 minutes | 2003-05-05 | ~564K | ~28 MB |
| 30 minutes | 2003-05-05 | ~282K | ~14 MB |
| 1 hour | 2003-05-05 | ~141K | ~7 MB |
| 4 hours | 2003-05-05 | ~35,300 | ~2 MB |
| Daily | 1999-06-03 | ~6,900 | ~343 KB |
| Monthly | 1999-06-03 | ~330 | ~16 KB |
Rule of thumb: ~40–50 bytes per CSV row. Full sizing logic in the file-size guide.
The other gold and silver pairs
The catalogue also carries gold crossed into other currencies — XAU/EUR, XAU/GBP, XAU/CHF (all from 2023-03-14) and XAU/JPY (from 2024-09-17) — young series, useful mainly for recent cross-currency work. Silver runs deeper: XAG/USD daily reaches 1999-06-03, and XAG/EUR back to 1985. All of them sit in the precious-metals catalogue, which lists every gold and silver pair with its own start date.
Getting it onto your machine
The desktop client fetches XAU/USD on your own machine, straight from the source archive — pick the timeframe and date range, get CSV or JSON in a folder you choose. From there: Excel / Google Sheets for charts, Python & pandas for research, MetaTrader for EA backtests. One licence (from €9, one-time) covers the full catalogue and full history — gold is not a premium tier, because nothing is.
Going deeper on gold
This page is the overview; the specifics each have their own guide: the tick archive (what quote-level gold data contains and what it costs in disk), backtesting gold (granularity by strategy, and the three gold-specific traps), and building the gold–silver ratio from this series and XAG/USD.
Frequently asked questions
- How far back does gold price data go?
- In this archive, spot gold (XAU/USD) has daily candles from 1999-06-03 and tick-level data from 2003-05-05. Longer gold series exist elsewhere (annual averages, auction fixes), but they are different data types, not continuous quotes.
- Is XAU/USD the same as gold futures data?
- No. XAU/USD is the continuous spot quote; futures data carries contract expiries, roll gaps and a term structure. Spot is usually the right series for charting and strategy research; futures data matters when you specifically trade or model the futures curve.
- Why do my gold daily candles disagree with another chart?
- Usually the daily cut-off. Spot gold trades nearly 23 hours, and different platforms close their "day" at different times — so two correct daily series can print different opens, highs and lows. Compare cut-off conventions before assuming the data is wrong.
- Is the gold data free to download?
- The archive is publicly reachable and the retrieval runs on your own machine. What you buy here is the software licence (from €9, one-time) that activates the desktop client — every tier reaches the same full gold history, because tiers differ only by software features.
Related markets
- Forex Metals historical data · 18 instruments
Related guides
- Gold Tick Data (XAU/USD): What You Get, and How Big It Is
- Backtesting a Gold Strategy on Historical Data
- Building the Gold–Silver Ratio from Historical Data
- How to Use MarketData Hub — The Complete Guide
- Historical Market Data CSV & JSON Format Explained
- Backtesting a Trading Strategy with Historical Data
- Download EUR/USD Price History
- How Far Back Does Historical Market Data Go?