XAU/USD Historical Data Downloader
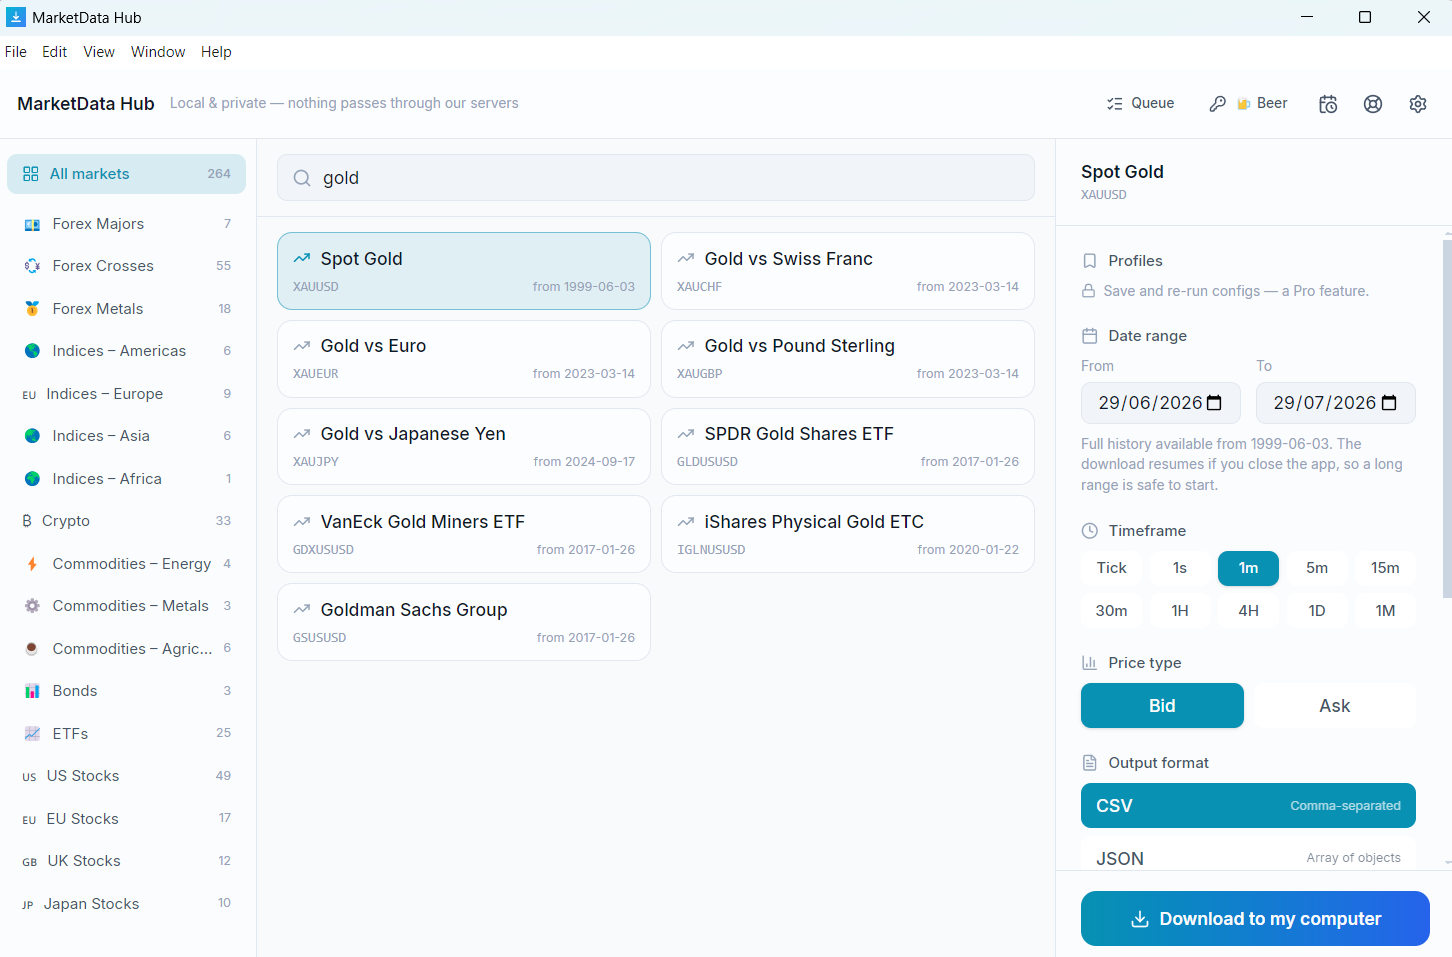
A desktop app that downloads Spot Gold (XAU/USD) price history on your own machine, written straight to your disk as CSV or JSON. Daily and monthly XAU/USD candles reach back to 1999-06-03 — around 27 years — while quote-level tick history begins 2003-05-05. A complete XAU/USD 1-minute series is roughly 8.5M rows, about 423 MB as CSV.
Preview a XAU/USD download →Or work out the size first: the file-size calculator takes a range and returns the row count and CSV size.
Windows, macOS, Linux · €9 one-time for the entry licence · get the app
What the app fetches for XAU/USD
| Symbol | XAU/USD |
|---|---|
| Instrument | Spot Gold |
| Asset class | Forex Metals |
| Tick & 1-second data from | 2003-05-05 |
| 1–30 minute candles from | 2003-05-05 |
| Hourly & 4-hour candles from | 2003-05-05 |
| Daily & monthly candles from | 1999-06-03 |
| Timeframes | Tick → 1s → 1m → 5m → 15m → 30m → 1h → 4h → Daily → Monthly |
| Price types | Bid & Ask (with volume) |
| File formats | CSV, JSON (MetaTrader, NinjaTrader, Parquet & SQLite/DuckDB from the Pro licence) |
| Coverage | 1999-06-03 → 2026-09-17 (last completed trading day) |
| Retrieval | Local — your machine connects directly to Dukascopy Bank SA |
| Runs on | Windows, macOS, Linux |
XAU/USD timeframes the app supports
- Tick (every quote)
- 1 second
- 1 minute
- 5 minutes
- 15 minutes
- 30 minutes
- 1 hour
- 4 hours
- Daily
- Monthly
XAU/USD coverage & file size, timeframe by timeframe
XAU/USD does not start at the same date at every granularity: daily candles begin 1999-06-03, but the tick archive only reaches 2003-05-05, roughly 4 years later. Each row below gives that timeframe's own start date and scale, current through 2026-09-17:
| Timeframe | History from | Approx. rows | Approx. CSV |
|---|---|---|---|
| Tick (every quote) | 2003-05-05 | very large | — |
| 1 second | 2003-05-05 | very large | — |
| 1 minute | 2003-05-05 | ~8.5M | ~423 MB |
| 5 minutes | 2003-05-05 | ~1.7M | ~85 MB |
| 15 minutes | 2003-05-05 | ~564K | ~28 MB |
| 30 minutes | 2003-05-05 | ~282K | ~14 MB |
| 1 hour | 2003-05-05 | ~141K | ~7 MB |
| 4 hours | 2003-05-05 | ~35,300 | ~2 MB |
| Daily | 1999-06-03 | ~6,900 | ~343 KB |
| Monthly | 1999-06-03 | ~330 | ~16 KB |
Counts are approximate, derived from forex session hours across the available history. Tick and 1-second runs are queued and resumable rather than fetched in one pass. See the data methodology for how candles are built.
Working with the XAU/USD series
Spot gold trades close to 23 hours a day, Sunday evening through Friday evening, with a short daily break — so gold "daily" candles do not align with an equity trading day, and joining them to stock data on date alone will silently misalign the series. The daily archive here reaches 1999; tick data begins 2003.
XAU/USD data by timeframe — what each one actually costs you
XAU/USD 1-minute historical data
The 1-minute series starts 2003-05-05 — the same date as the tick archive, because minute candles are aggregated from ticks rather than stored separately. The complete run to today is 8.5M rows, about 423 MB as CSV, which is the largest file most people here actually finish. It opens in pandas or DuckDB without complaint and defeats Excel's row limit several times over; the Excel and Google Sheets guide covers what to do about that.
XAU/USD 5-minute and 15-minute historical data
Both are built from the same 2003-05-05 start. Five-minute is 1.7M rows, about 85 MB as CSV; 15-minute is 564K rows, about 28 MB as CSV. Neither is a downsample of a file you already have — ask for the timeframe you want and the app aggregates it from ticks directly, so the candles are correct at their own boundaries rather than resampled from an intermediate grid.
XAU/USD daily OHLC
Daily is the deep one: it reaches back to 1999-06-03, roughly 4 years before the tick archive begins, and the whole history is only 6,900 rows, about 343 KB as CSV. If you want the longest XAU/USD series available and do not need intraday structure, this is it — and it is small enough that fetching it takes under a minute. Monthly candles share the same 1999-06-03 start.
Just the last 14 or 30 days
Every timeframe takes an explicit date range, so a short window is a short download, not a filtered long one — the app requests only the chunks the range covers. A month of XAU/USD 1-minute data is a few hundred kilobytes and finishes in seconds; a month of ticks is a queued, resumable job. Set the range before you set the timeframe and the size estimate updates as you go, or work it out first with the file-size calculator.
Is XAU/USD historical data free?
The app is a free download and the data is not resold by us at any price — your machine fetches it directly from Dukascopy Bank SA in your own name, and nothing passes through our servers. What a licence buys is the software: export formats, bulk queueing, automation. It does not buy access to instruments or to history. Every licence, including the €9 entry tier, reaches the full XAU/USD archive at every timeframe — there is no date range or download count behind a higher tier. See what each tier changes.
Looking for the HistData DAT_MT_XAUUSD_M1_YYYYMM.csv files?
Those filenames are HistData's month-by-month 1-minute gold files in MetaTrader layout, and a search for a specific month usually means that month has not been published there yet. The app produces the equivalent from the source directly: set the range to the month you want, pick 1 minute, and export — CSV or JSON on every tier, or the MetaTrader CSV layout (a Pro format) if an import needs the DAT_MT column order. The month does not have to be complete: the current one is fetched up to the last finished trading day, and a single month of XAU/USD M1 is a few hundred kilobytes. The HistData comparison covers what else differs.
What's inside the XAU/USD file
timestamp,open,high,low,close,volumeOne row per candle; tick files instead carry timestamp,bid,ask on every quote. All timestamps are UTC. Worked examples and import steps are in the CSV & JSON format guide.
About Spot Gold
Spot Gold (XAU/USD) is a spot precious-metals instrument with 27 years of retrievable history. It is commonly used for backtesting forex trading strategies and expert advisors (EAs), spread and volatility analysis, training algorithmic and machine-learning models, and charting currency-pair history. Pick any date range from 1999-06-03 onward, choose a timeframe and the bid or ask side, and the app fetches and writes the files locally — no scripting.
Frequently asked questions
- How far back does XAU/USD data go?
- XAU/USD daily and monthly candles reach back to 1999-06-03 — roughly 27 years. Tick and intraday history is shorter: it begins 2003-05-05. Both run up to the last completed trading day, and every licence tier reaches all of it.
- Why does XAU/USD tick data start later than its daily candles?
- Because they come from different parts of the archive. Daily and monthly XAU/USD candles are reconstructed from long-run end-of-day records going back to 1999-06-03, while the tick archive — every individual bid/ask quote — only begins 2003-05-05, about 4 years later. If your study needs the full 27-year span, work in daily candles; if it needs quote-level detail, 2003-05-05 is the earliest XAU/USD start date available.
- How large is a full XAU/USD download?
- The complete XAU/USD 1-minute history is roughly 8.5M rows, about 423 MB as CSV. Daily candles over the same instrument are far smaller — around 6,900 rows, 343 KB. Tick and 1-second runs are larger again and are queued and resumable rather than fetched in one pass. Sizes are approximate; nothing is priced by volume.
- What columns are in the XAU/USD CSV file?
- OHLC files contain a timestamp plus open, high, low and close columns (with volume); tick files contain a timestamp with bid and ask prices. All timestamps are UTC. The files import directly into Excel, Google Sheets, Python (pandas read_csv), R, MetaTrader, NinjaTrader and TradingView.
- Do you sell XAU/USD data?
- No — we sell software. The MarketData Hub client retrieves Spot Gold (XAU/USD) on your own machine, under your instruction, directly from the source; we never host, cache or relay it. Your use of the retrieved data is subject to the source's terms.
Guides
- Get the app — Windows, macOS, Linux
- How to download historical forex data
- CSV & JSON format — columns explained
- Tick data vs OHLC candles
- Backtesting with historical data
- Gold price history
- Gold tick data
- Backtesting gold
- Gold–silver ratio
Related Forex Metals
- XAG/USD — Spot Silver
- XAG/EUR — Silver vs Euro
- XAG/GBP — Silver vs Pound Sterling
- XAG/AUD — Silver vs Australian Dollar
- XAU/CHF — Gold vs Swiss Franc
- XAU/EUR — Gold vs Euro
- XAU/GBP — Gold vs Pound Sterling
- XAG/HKD — Silver vs Hong Kong Dollar
- XAG/MXN — Silver vs Mexican Peso
- XAG/NZD — Silver vs New Zealand Dollar
- XAG/DKK — Silver vs Danish Krone
- XAG/SEK — Silver vs Swedish Krona
Preview your XAU/USD download — pick a range, see the exact file →
Sizing it up rather than fetching it? Estimate XAU/USD rows and CSV size for any date range.
The preview runs in the browser; the download runs in the free desktop app, on your machine.