How to Download Historical Market Data
Getting clean historical price data used to mean paid feeds or messy scraping. This guide walks through downloading it — from raw ticks to monthly candles — for 265+ instruments with a desktop app that fetches straight from the public source archive on your own machine, ready for backtesting, charting or research. The app is free to install; a one-time licence (from €9) activates it, and what you may do with the data follows the source's own terms.
Get the app — €9 →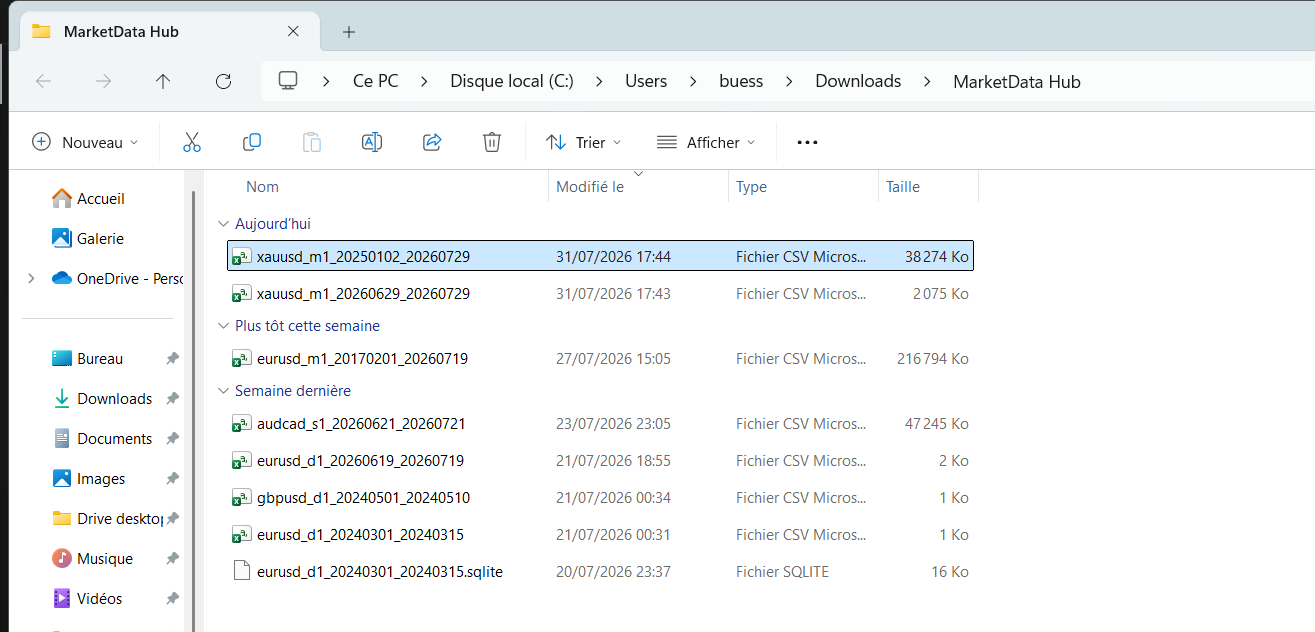
Step 0 — Install the app
The retrieval runs locally, so there's an app rather than a web export: create a free account and download the client for Windows, macOS, Linux — the app is free to install — then buy a licence (€9 one-time for the entry tier) and sign in to activate it. Everything below happens inside it — and the picker on our home page mirrors the same interface, so you can walk the whole flow before you buy anything.
Step 1 — Find your instrument
Search by name or symbol, or browse by asset class: forex majors, cryptocurrencies, stock indices, commodities, bonds, ETFs and individual shares. See the full list on the all markets page. Popular picks: EUR/USD, BTC/USD, Gold (XAU/USD) and the US 500 index.
Step 2 — Choose a timeframe
Pick the granularity your use case needs: tick data (every quote) for spread and microstructure analysis, 1-minute to 1-hour candles for intraday backtests, or daily and monthly candles for long-term studies. Coarser timeframes mean smaller files and longer available history — see tick data vs OHLC candles if you're unsure which to pick.
Step 3 — Set the date range
Each instrument lists exactly how far back its data goes, and the start date differs by timeframe — daily candles often reach decades further than ticks. Pick any window inside the available range: nothing is priced by span, so a decade costs exactly what a day does.
Step 4 — Pick the format and price side
Write CSV (universal — opens in Excel, pandas, MetaTrader) or JSON (handy for code), and choose bid or ask prices. See the CSV & JSON format guide for the exact columns. Higher licences add MetaTrader, NinjaTrader, Parquet and SQLite/DuckDB writers — the last of those a single indexed database file you can query directly.
Step 5 — Run it
Press go and the app opens a direct connection from your machine to the archive, decodes and aggregates locally, and writes the file into the folder you chose. Long tick runs are queued and paced so the source doesn't rate-limit you, and resume from where they stopped if you close the app. Nothing about the job — which instrument, which range — is ever sent to us.
What you can do with the data
Backtest trading strategies and expert advisors, train quantitative and machine-learning models, chart long-term history, study volatility and spreads, or build research datasets. Next: backtesting a strategy with historical data.
Frequently asked questions
- Do you sell the data?
- No. We sell software that fetches data for you, on your own computer, directly from the source. The archive itself is published publicly by Dukascopy Bank SA and your use of what you retrieve is subject to their terms — we never host, cache or resell it.
- What does it cost?
- €9 once for the entry licence — a one-time purchase, not a subscription. Every licence unlocks all 265+ instruments, every timeframe and the full history; higher tiers add export formats, bulk queueing and a headless CLI with a scheduler — never more data.
- Can I download tick data?
- Yes. Raw tick data (every quote with bid/ask) is available alongside OHLC candles at every licence tier. Tick history generally starts later than daily candles, and the available start date is shown per instrument.
- Do I need to install anything?
- Yes — a desktop app, for Windows, macOS, Linux. That is the point: the retrieval runs on your machine, so your instrument selections and downloaded files never touch anyone else's server.