Loading Historical Market Data in Python (pandas, Backtrader & VectorBT)
Python is where most quantitative research happens. This guide shows how to load our CSV/JSON exports into pandas with a clean datetime index, resample timeframes, and plug the data into Backtrader and VectorBT.
Load a CSV into pandas
Download an instrument as CSV (e.g. EUR/USD 1-minute) and read it with a parsed datetime index:
import pandas as pd

df = pd.read_csv("eurusd_m1_20240101_20250101.csv")
# The timestamp column is epoch milliseconds (UTC), not a date string.
df["timestamp"] = pd.to_datetime(df["timestamp"], unit="ms", utc=True)
df = df.set_index("timestamp").sort_index()   # exports are already ascending
print(df.head())
Timestamps are UTC, so you can compare and join instruments without timezone headaches. parse_dates=["timestamp"], the usual idiom for date strings, does not work on this column: it leaves the integers untouched without an error. The format guide lists every column.
Resample to another timeframe
Already have 1-minute candles but want hourly? Resample OHLC correctly:
agg = {"open": "first", "high": "max", "low": "min", "close": "last", "volume": "sum"}
hourly = df.resample("1H").agg(agg).dropna()
Downsampling (finer → coarser) is exact; you can't invent finer data from coarser, so download the granularity you need. See tick vs OHLC.
Load JSON instead
df = pd.read_json("eurusd_m1_20240101_20250101.json", convert_dates=False)
df["timestamp"] = pd.to_datetime(df["timestamp"], unit="ms", utc=True)
df = df.set_index("timestamp").sort_index()
Feed Backtrader
import backtrader as bt

data = bt.feeds.PandasData(dataname=df)
cerebro = bt.Cerebro()
cerebro.adddata(data)
# cerebro.addstrategy(MyStrategy); cerebro.run()
Feed VectorBT
import vectorbt as vbt

price = df["close"]
fast = price.rolling(10).mean()
slow = price.rolling(50).mean()
entries = fast > slow
exits = fast < slow
pf = vbt.Portfolio.from_signals(price, entries, exits, freq="1min")
print(pf.total_return())
Or try an idea on the chart first
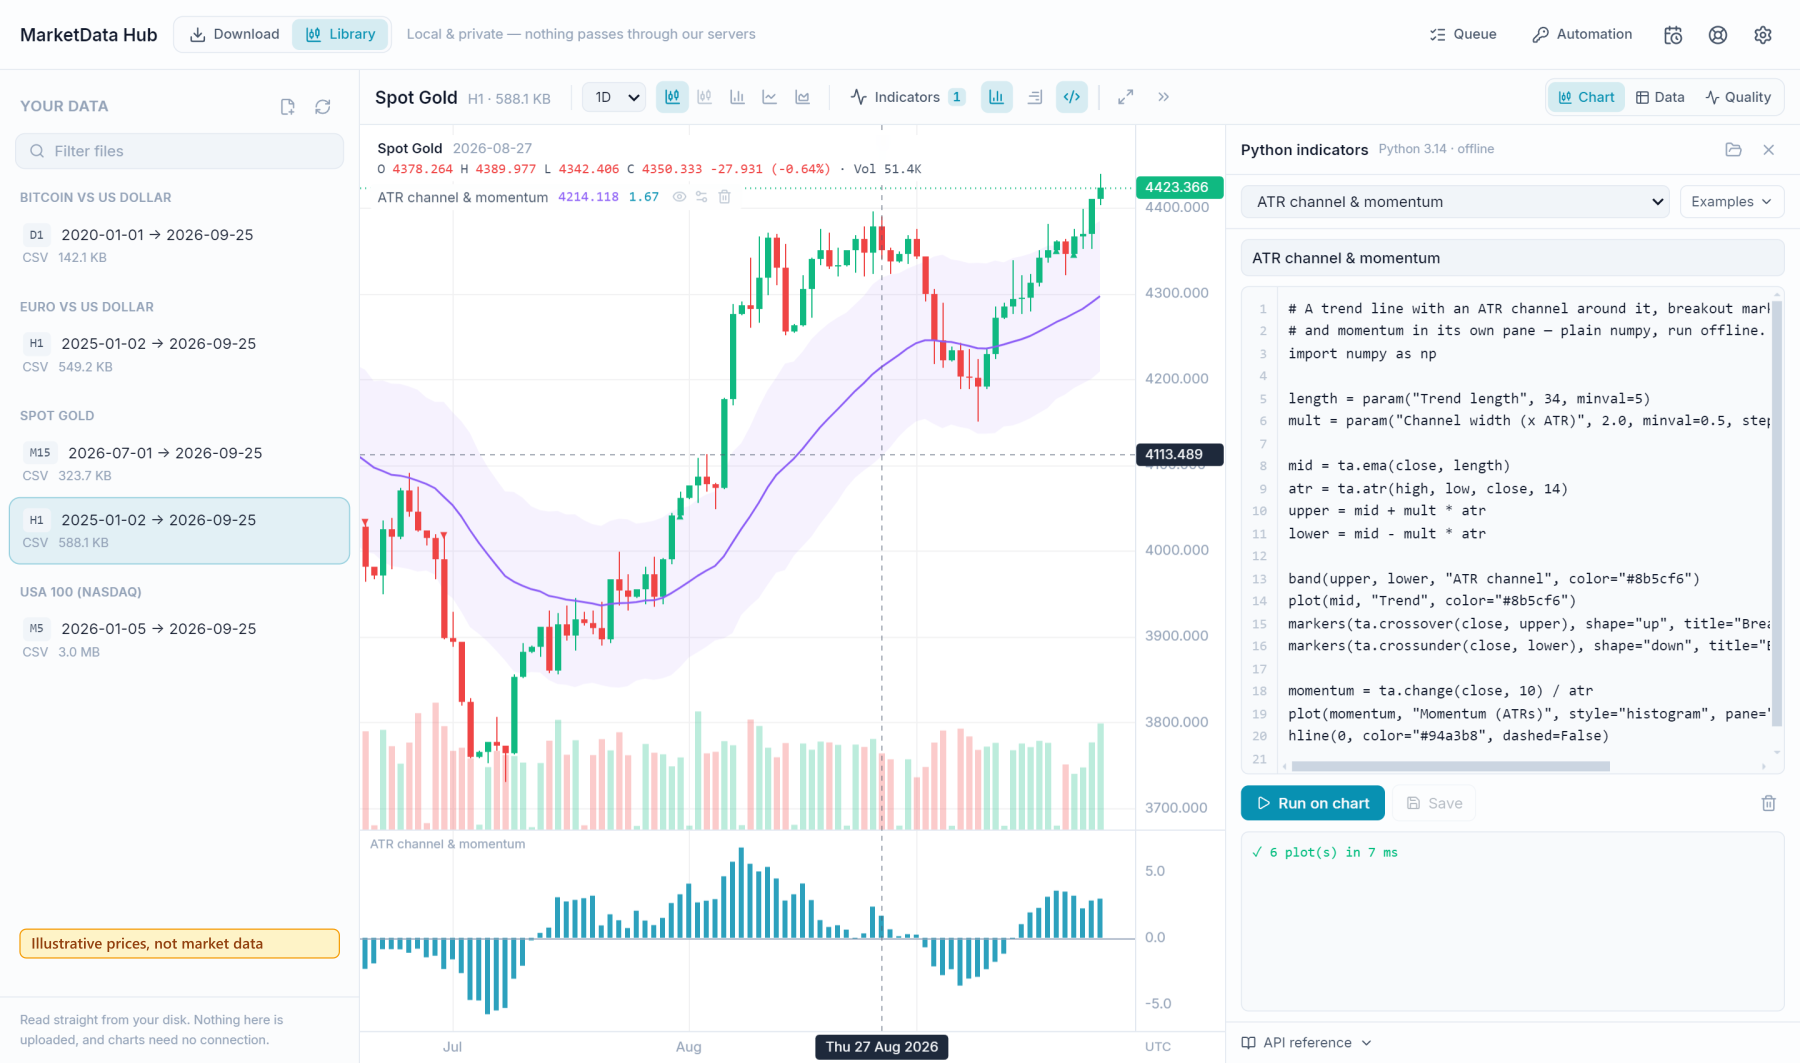
Before writing a full backtest, it often helps to see an indicator on the data. The app's built-in chart viewer opens any file you downloaded and runs Python indicators written with the same numpy and pandas as above — offline, inside the app, with no setup. Sketch it there, then move the logic into your backtest.
Mind look-ahead and survivorship bias when you build signals. Ready? Browse all instruments and grab a file.
Frequently asked questions
- How do I load the CSV into pandas?
- Read it with pandas.read_csv, then convert the timestamp column with pd.to_datetime(df["timestamp"], unit="ms", utc=True) and set it as the index. The column holds epoch milliseconds, so parse_dates alone leaves it as integers. The JSON export loads with pandas.read_json and the same conversion.
- How do I convert 1-minute data to hourly or daily?
- Resample with pandas: aggregate open="first", high="max", low="min", close="last", volume="sum". You can only downsample to a coarser timeframe — download the finest granularity you actually need.
- Does the data work with Backtrader and VectorBT?
- Yes. For Backtrader wrap the DataFrame in bt.feeds.PandasData; for VectorBT pass the close series (and signals) into Portfolio.from_signals. Both expect a clean datetime index, which the exports provide.
- Are the timestamps timezone-aware?
- Timestamps are epoch milliseconds in UTC. Converting with pd.to_datetime(..., unit="ms", utc=True) gives a timezone-aware UTC index directly; use tz_convert to view it in a market's local time.
Related markets
- Crypto historical data · 33 instruments
- ETFs historical data · 25 instruments
- US Stocks historical data · 49 instruments
- EU Stocks historical data · 18 instruments
Related guides
- Backtesting a Trading Strategy with Historical Data
- Querying Historical Market Data with SQL (DuckDB)
- Automating Market Data Downloads
- How to Import Historical Data into MetaTrader 4 & 5
- Importing Historical Data into NinjaTrader 8
- Historical Market Data in Excel & Google Sheets
- How to Use MarketData Hub — The Complete Guide
- Download Gold (XAU/USD) Price History
- Historical Market Data CSV & JSON Format Explained
- Download EUR/USD Price History
- How Far Back Does Historical Market Data Go?