USD/NOK Historical Data Downloader
A desktop app that downloads US Dollar vs Norwegian Krone (USD/NOK) price history on your own machine, written straight to your disk as CSV or JSON. Daily and monthly USD/NOK candles reach back to 1991-03-27 — around 35 years — while quote-level tick history begins 2003-08-04. A complete USD/NOK 1-minute series is roughly 8.4M rows, about 419 MB as CSV.
Preview a USD/NOK download →Or work out the size first: the file-size calculator takes a range and returns the row count and CSV size.
Windows, macOS, Linux · €9 one-time for the entry licence · get the app
What the app fetches for USD/NOK
| Symbol | USD/NOK |
|---|---|
| Instrument | US Dollar vs Norwegian Krone |
| Asset class | Forex Crosses |
| Tick & 1-second data from | 2003-08-04 |
| 1–30 minute candles from | 2003-08-04 |
| Hourly & 4-hour candles from | 2003-08-03 |
| Daily & monthly candles from | 1991-03-27 |
| Timeframes | Tick → 1s → 1m → 5m → 15m → 30m → 1h → 4h → Daily → Monthly |
| Price types | Bid & Ask (with volume) |
| File formats | CSV, JSON (MetaTrader, NinjaTrader, Parquet & SQLite/DuckDB from the Pro licence) |
| Coverage | 1991-03-27 → 2026-09-17 (last completed trading day) |
| Retrieval | Local — your machine connects directly to Dukascopy Bank SA |
| Runs on | Windows, macOS, Linux |
USD/NOK timeframes the app supports
- Tick (every quote)
- 1 second
- 1 minute
- 5 minutes
- 15 minutes
- 30 minutes
- 1 hour
- 4 hours
- Daily
- Monthly
USD/NOK coverage & file size, timeframe by timeframe
USD/NOK does not start at the same date at every granularity: daily candles begin 1991-03-27, but the tick archive only reaches 2003-08-04, roughly 12 years later. Each row below gives that timeframe's own start date and scale, current through 2026-09-17:
| Timeframe | History from | Approx. rows | Approx. CSV |
|---|---|---|---|
| Tick (every quote) | 2003-08-04 | very large | — |
| 1 second | 2003-08-04 | very large | — |
| 1 minute | 2003-08-04 | ~8.4M | ~419 MB |
| 5 minutes | 2003-08-04 | ~1.7M | ~84 MB |
| 15 minutes | 2003-08-04 | ~558K | ~28 MB |
| 30 minutes | 2003-08-04 | ~279K | ~14 MB |
| 1 hour | 2003-08-03 | ~140K | ~7 MB |
| 4 hours | 2003-08-03 | ~34,900 | ~2 MB |
| Daily | 1991-03-27 | ~8,900 | ~446 KB |
| Monthly | 1991-03-27 | ~430 | ~21 KB |
Counts are approximate, derived from forex session hours across the available history. Tick and 1-second runs are queued and resumable rather than fetched in one pass. See the data methodology for how candles are built.
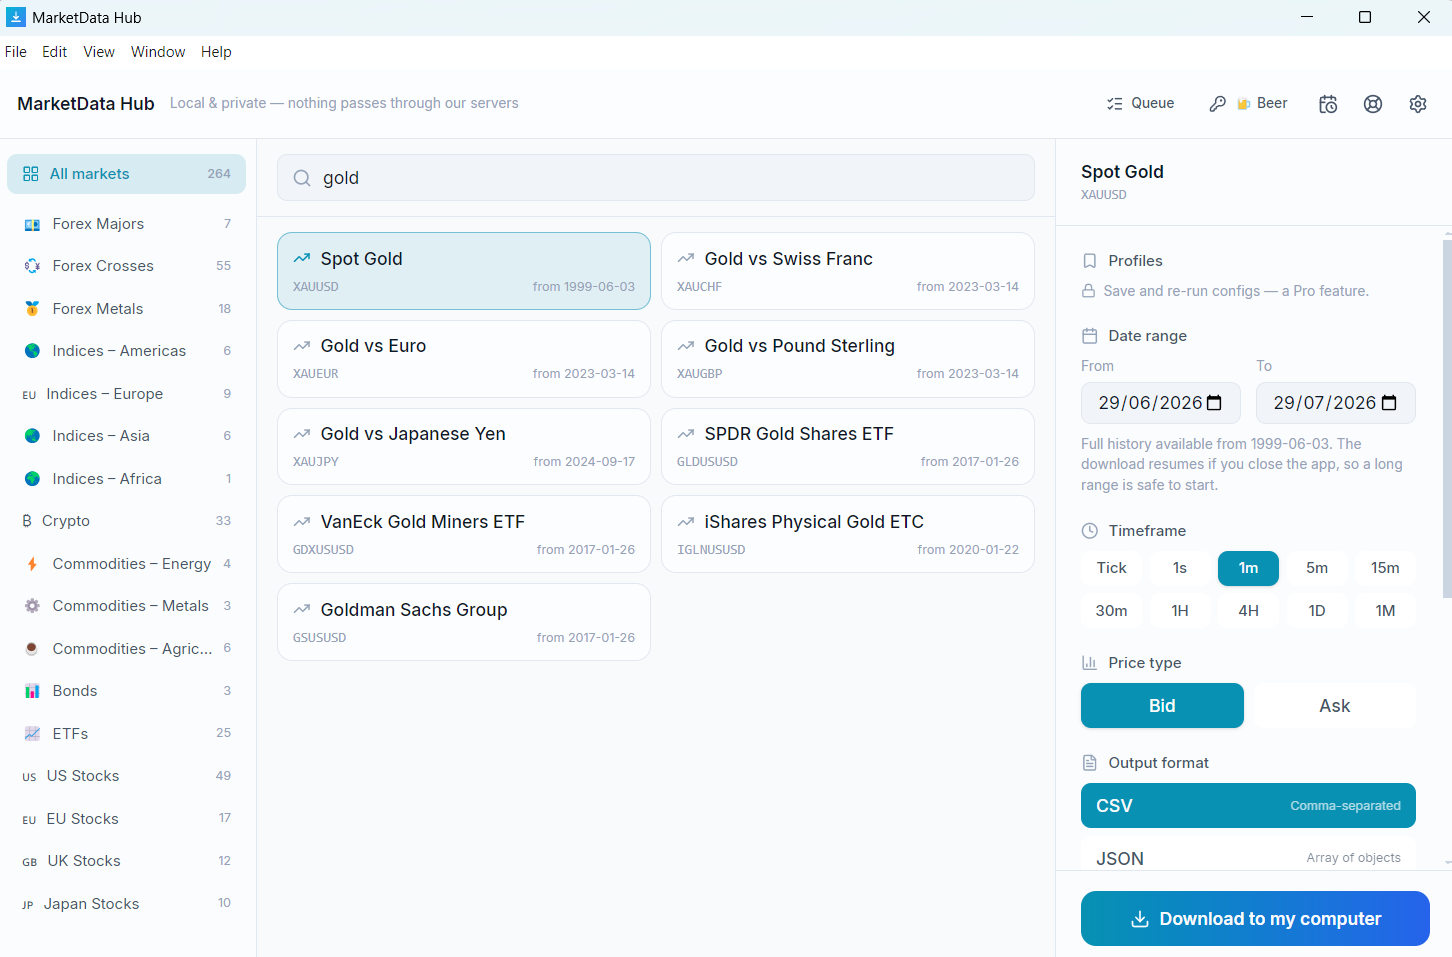
Working with the USD/NOK series
An oil currency against the dollar, with the March 2020 episode as its stress benchmark: crude's collapse plus a global dollar scramble drove USD/NOK up double-digit percent in days, through levels no volatility model fitted on the prior decade considered plausible. Norwegian krone liquidity evaporates in exactly those moments. Size positions off stress-window behaviour, not the placid average.
What's inside the USD/NOK file
timestamp,open,high,low,close,volumeOne row per candle; tick files instead carry timestamp,bid,ask on every quote. All timestamps are UTC. Worked examples and import steps are in the CSV & JSON format guide.
About US Dollar vs Norwegian Krone
US Dollar vs Norwegian Krone (USD/NOK) is a spot forex pair with 35 years of retrievable history. It is commonly used for backtesting forex trading strategies and expert advisors (EAs), spread and volatility analysis, training algorithmic and machine-learning models, and charting currency-pair history. Pick any date range from 1991-03-27 onward, choose a timeframe and the bid or ask side, and the app fetches and writes the files locally — no scripting.
Frequently asked questions
- How far back does USD/NOK data go?
- USD/NOK daily and monthly candles reach back to 1991-03-27 — roughly 35 years. Tick and intraday history is shorter: it begins 2003-08-04. Both run up to the last completed trading day, and every licence tier reaches all of it.
- Why does USD/NOK tick data start later than its daily candles?
- Because they come from different parts of the archive. Daily and monthly USD/NOK candles are reconstructed from long-run end-of-day records going back to 1991-03-27, while the tick archive — every individual bid/ask quote — only begins 2003-08-04, about 12 years later. If your study needs the full 35-year span, work in daily candles; if it needs quote-level detail, 2003-08-04 is the earliest USD/NOK start date available.
- How large is a full USD/NOK download?
- The complete USD/NOK 1-minute history is roughly 8.4M rows, about 419 MB as CSV. Daily candles over the same instrument are far smaller — around 8,900 rows, 446 KB. Tick and 1-second runs are larger again and are queued and resumable rather than fetched in one pass. Sizes are approximate; nothing is priced by volume.
- What columns are in the USD/NOK CSV file?
- OHLC files contain a timestamp plus open, high, low and close columns (with volume); tick files contain a timestamp with bid and ask prices. All timestamps are UTC. The files import directly into Excel, Google Sheets, Python (pandas read_csv), R, MetaTrader, NinjaTrader and TradingView.
- Do you sell USD/NOK data?
- No — we sell software. The MarketData Hub client retrieves US Dollar vs Norwegian Krone (USD/NOK) on your own machine, under your instruction, directly from the source; we never host, cache or relay it. Your use of the retrieved data is subject to the source's terms.
Guides
- Get the app — Windows, macOS, Linux
- How to download historical forex data
- CSV & JSON format — columns explained
- Tick data vs OHLC candles
- Backtesting with historical data
- Import into MetaTrader
- Load in Python (pandas)
- How far back data goes
- vs HistData
- Import into NinjaTrader
Related Forex Crosses
- AUD/CAD — Australian Dollar vs Canadian Dollar
- AUD/CHF — Australian Dollar vs Swiss Franc
- AUD/JPY — Australian Dollar vs Japanese Yen
- AUD/NZD — Australian Dollar vs New Zealand Dollar
- CAD/CHF — Canadian Dollar vs Swiss Franc
- CAD/JPY — Canadian Dollar vs Japanese Yen
- CHF/JPY — Swiss Franc vs Japanese Yen
- EUR/AUD — Euro vs Australian Dollar
- EUR/CAD — Euro vs Canadian Dollar
- EUR/CHF — Euro vs Swiss Franc
- EUR/DKK — Euro vs Danish Krone
- EUR/GBP — Euro vs Pound Sterling
Preview your USD/NOK download — pick a range, see the exact file →
Sizing it up rather than fetching it? Estimate USD/NOK rows and CSV size for any date range.
The preview runs in the browser; the download runs in the free desktop app, on your machine.