Natural Gas Historical Data Downloader
A desktop app that downloads Natural Gas (GASCMDUSD) price history on your own machine, written straight to your disk as CSV or JSON. History runs from 2012-09-02 — around 14 years — at every timeframe from raw ticks to monthly candles. A complete Natural Gas 1-minute series is roughly 5.1M rows, about 257 MB as CSV.
Or work out the size first: the file-size calculator takes a range and returns the row count and CSV size.
Windows, macOS, Linux · €9 one-time for the entry licence · get the app
What the app fetches for Natural Gas
| Symbol | GASCMDUSD |
|---|---|
| Instrument | Natural Gas |
| Asset class | Commodities – Energy |
| History available from | 2012-09-02 |
| Timeframes | Tick → 1s → 1m → 5m → 15m → 30m → 1h → 4h → Daily → Monthly |
| Price types | Bid & Ask |
| File formats | CSV, JSON (MetaTrader, NinjaTrader, Parquet & SQLite/DuckDB from the Pro licence) |
| Coverage | 2012-09-02 → 2026-11-02 (last completed trading day) |
| Retrieval | Local — your machine connects directly to Dukascopy Bank SA |
| Runs on | Windows, macOS, Linux |
Natural Gas timeframes the app supports
- Tick (every quote)
- 1 second
- 1 minute
- 5 minutes
- 15 minutes
- 30 minutes
- 1 hour
- 4 hours
- Daily
- Monthly
Natural Gas coverage & file size, timeframe by timeframe
Every Natural Gas timeframe shares the same 2012-09-02 start date, but not the same scale — coarser candles stay small while tick and intraday files grow fast. Current through 2026-11-02:
| Timeframe | History from | Approx. rows | Approx. CSV |
|---|---|---|---|
| Tick (every quote) | 2012-09-02 | very large | — |
| 1 second | 2012-09-02 | very large | — |
| 1 minute | 2012-09-02 | ~5.1M | ~257 MB |
| 5 minutes | 2012-09-02 | ~1.0M | ~51 MB |
| 15 minutes | 2012-09-02 | ~343K | ~17 MB |
| 30 minutes | 2012-09-02 | ~171K | ~9 MB |
| 1 hour | 2012-09-02 | ~85,700 | ~4 MB |
| 4 hours | 2012-09-02 | ~21,400 | ~1 MB |
| Daily | 2012-09-02 | ~3,600 | ~178 KB |
| Monthly | 2012-09-02 | ~170 | ~8 KB |
Counts are approximate, derived from commodity session hours across the available history. Tick and 1-second runs are queued and resumable rather than fetched in one pass. See the data methodology for how candles are built.
Working with the Natural Gas series
US natural gas is the most seasonal major commodity — winter demand spikes, storage cycles — and among the most violent: 2022 took it above $9 before 2023-24 crushed it back to multi-year lows. For a continuous series the roll matters more here than almost anywhere, because the futures curve's steep seasonal contango means the front-month "price" can bleed downward at rolls in ways a spot chart never shows. Do not read long-hold returns off this series without understanding that.
Natural gas historical data — the most seasonal file in the catalogue
Natural gas tick and 1-minute data
Every timeframe starts 2012-09-02, ticks and daily alike. The full 1-minute run is 5.1M rows, about 257 MB as CSV; the complete daily history is 3,600 rows, about 178 KB as CSV. This is US Henry Hub gas, quoted in US dollars per MMBtu (million British thermal units) — not per therm and not per megawatt-hour — so comparing it with a European gas series (euros per MWh) needs a unit conversion and an exchange rate before the numbers mean anything side by side.
Thursday 10:30 New York: the storage report
The US Energy Information Administration publishes its weekly natural gas storage report on Thursdays at 10:30 am Eastern time, moving it in holiday weeks. In UTC that is 14:30 during US daylight time and 15:30 in winter. It is the week's main scheduled event for this market, and its minute often shows in the 1-minute file as a burst of range. An event study has to use New York time and the EIA's published schedule — a fixed UTC minute, or "every Thursday", gets the holiday weeks and half the year wrong.
Twelve rolls a year
Henry Hub futures stop trading on the third-to-last business day of the month before delivery, so a continuous series moves to the next contract every month — twelve joins a year, each one a possible jump that no trader experienced as a price move. Mark them before running anything that reacts to gaps or breakouts.
From $10 to $1.51 in eighteen months
Front-month futures touched $10.01 intraday on 23 August 2022, the first time above $10 since 2008, then fell to $1.511 on 27 February 2024, the lowest since June 2020 — down roughly 85%. Inside one file, then, the same dollar move is a quiet day at one end and a crash at the other. Stops, targets and volatility filters written in dollars per MMBtu mean completely different things across this range; express them in percent or in units of recent volatility.
Is natural gas historical data free?
The app is a free download and the data comes straight from Dukascopy Bank SA to your disk, never through our servers. Every licence, including the €9 entry tier, reaches the whole archive at every timeframe — tiers differ by software features, never by history.
What's inside the Natural Gas file
timestamp,open,high,low,closeOne row per candle, stamped with the bar's opening time; tick files instead carry timestamp,askPrice,bidPrice,askVolume,bidVolume on every quote — ask first. Timestamps are epoch milliseconds in UTC, which pd.to_datetime(df.timestamp, unit="ms", utc=True) or =A2/86400000+DATE(1970,1,1) turns into a date. Worked examples and import steps are in the CSV & JSON format guide.
About Natural Gas
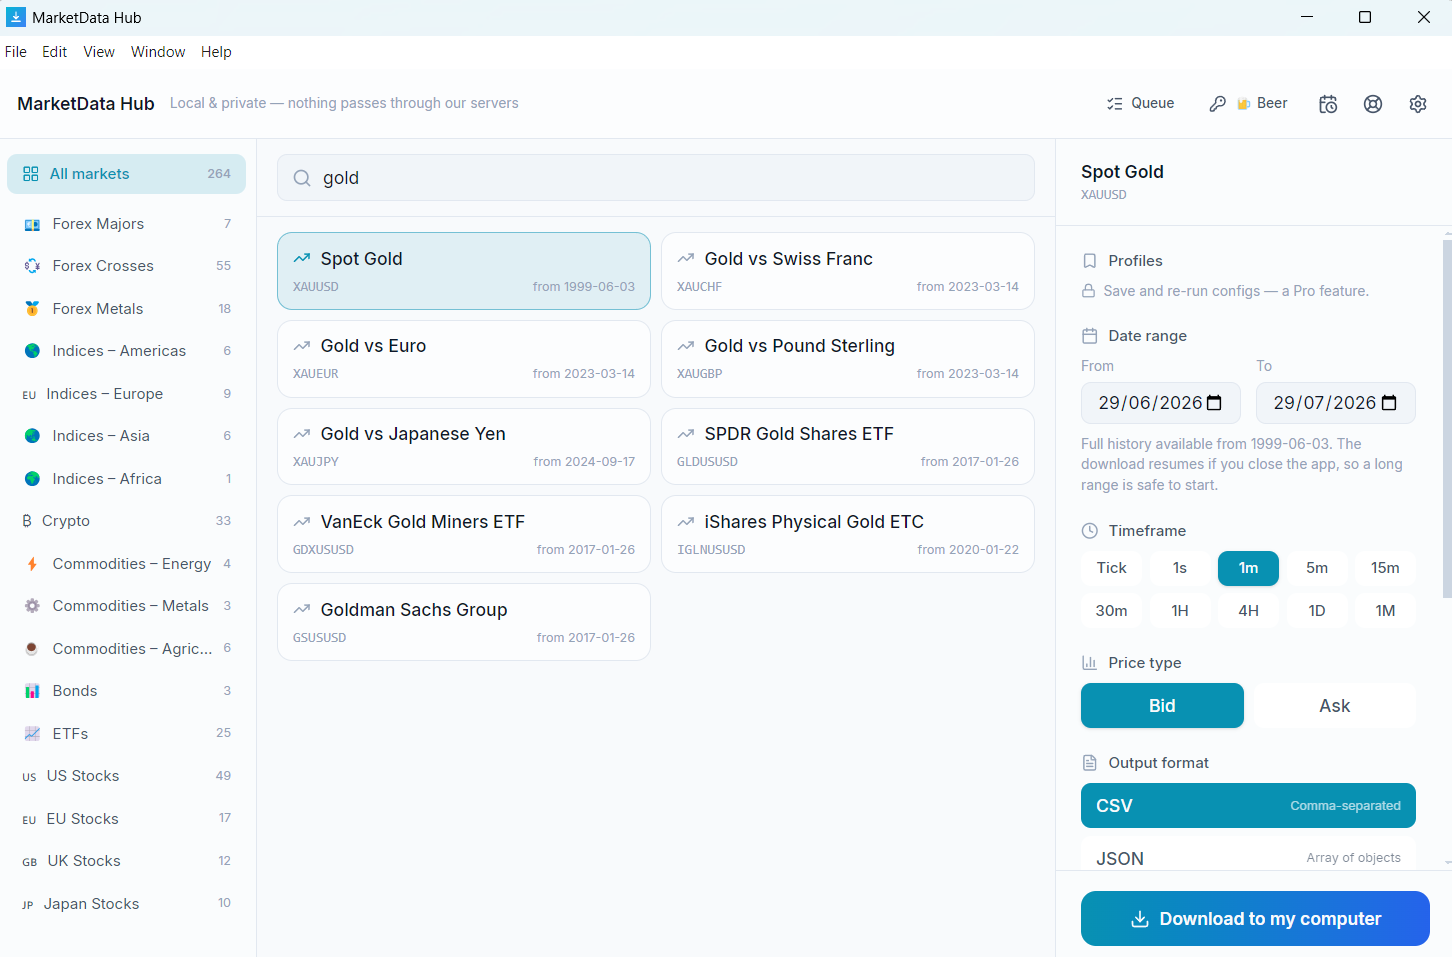
Natural Gas (GASCMDUSD) is a commodity CFD with 14 years of retrievable history. It is commonly used for backtesting commodity and futures strategies, seasonality and volatility studies, hedging research and quantitative model training. Pick any date range from 2012-09-02 onward, choose a timeframe and the bid or ask side, and the app fetches and writes the files locally — no scripting.
Frequently asked questions
- How far back does Natural Gas data go?
- Natural Gas history runs from 2012-09-02 — roughly 14 years — up to the last completed trading day, at every timeframe from raw ticks to monthly candles. Every licence tier reaches all of it.
- How large is a full Natural Gas download?
- The complete Natural Gas 1-minute history is roughly 5.1M rows, about 257 MB as CSV. Daily candles over the same instrument are far smaller — around 3,600 rows, 178 KB. Tick and 1-second runs are larger again and are queued and resumable rather than fetched in one pass. Sizes are approximate; nothing is priced by volume.
- What columns are in the Natural Gas CSV file?
- OHLC files contain a timestamp plus open, high, low and close columns; tick files contain a timestamp with bid and ask prices. All timestamps are UTC. The files import directly into Excel, Google Sheets, Python (pandas read_csv), R, MetaTrader, NinjaTrader and TradingView.
- Do you sell Natural Gas data?
- No — we sell software. The MarketData Hub client retrieves Natural Gas (GASCMDUSD) on your own machine, under your instruction, directly from the source; we never host, cache or relay it. Your use of the retrieved data is subject to the source's terms.
Guides
- Get the app — Windows, macOS, Linux
- How to download historical commodity data
- CSV & JSON format — columns explained
- Tick data vs OHLC candles
- Backtesting with historical data
- Query with SQL (DuckDB)
- Import into NinjaTrader
Related Commodities – Energy
Preview your Natural Gas download — pick a range, see the exact file →
Sizing it up rather than fetching it? Estimate Natural Gas rows and CSV size for any date range.
The preview runs in the browser; the download runs in the free desktop app, on your machine.